
Voting reduced by 9.50 percent from last time
The highest voter turnout was 68.36 percent in Matiamhal region and the lowest 39.52 in Delhi Cantt.
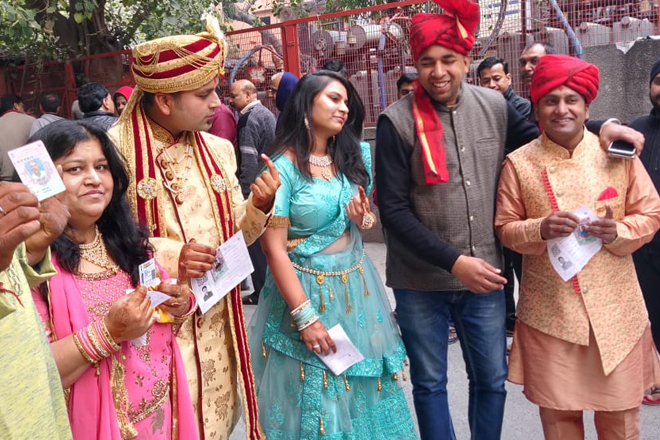
New Delhi, 08 February (HC). Voting ended on Saturday for the Delhi Assembly elections. On an average 57.75 percent turnout was recorded in all 70 seats.
However, the final polling figures are likely to increase by one-half percent, as the final figures of all the polling stations are yet to be received. This time around 9.50 percent less polling has been done than last time.
The turnout was peaceful except for minor incidents. In the 2015 elections, the turnout was 67.12 percent. This is the seventh assembly election in Delhi since 1993. In the year 1993, there was 61.75 percent voting.
According to the Central Election Commission’s data till 7.50 pm, the highest turnout of 68.36 per cent of the 70 seats in the assembly was held in the Mattiamhal region, while the Delhi Cantt area recorded the lowest 39.52 per cent.
With this, the fate of a total of 672 candidates in all 70 seats has been captured in EVMs. The counting of votes will take place on February 11 and the results will also be out by noon on the same day.
New Delhi seat has the maximum number of 28 candidates and the least four candidates are trying their luck from Patel Nagar constituency. There are 22 candidates in Burari seat and 18 in Karavalanagar seat.
This time the main contest is believed to be between the ruling Aam Aadmi Party (AAP) and the BJP. AAP has fielded Chief Minister Arvind Kejriwal from the New Delhi seat. Deputy Chief Minister Manish Sisodia is trying his luck from Patparganj seat as an AAP candidate. While the BJP has fielded Leader of Opposition in the Assembly, Vijender Gupta, in the Rohini seat.
There are a total of 1,47,86,389 voters in all the 70 seats of the assembly. Of these, 81,05,236 are male and 66,80,277 female, while 869 are third gender voters. According to the Election Commission, the number of first-time voters is 2,32,815.
In Shaheenbagh area of Okhla assembly constituency, people gathered in large numbers to vote. Protests have been going on since December 15 against the Citizenship Amendment Act (CAA) and the National Register of Citizens (NRC). During the election campaign, there was a lot of rhetoric at the venue. Five polling booths were built at Shaheenbagh.
Legislative voting percentage
Narela 64.98, Buradi 58.60, Timarpur 51.17, Adarsh Nagar 53.25, Badli 62.38, Rithala 51.20, Bawana 41.95, Mundka 59.25, Kiradi 55.67, Sultanpur Mazra 61.87, Nangloi 53.15, Mangolpuri 59.59, Rohini 62.89, Shalimar Bagh 50.72, Shakimar Bagh 59.79 , Wazirpur 60.38, Model Town 59.36, Sadar Bazar 64.61, Chandni Chowk 46.21, Mattiamhal 68.36, Ballimaran 48.28, Karolbagh 54.79, Patel Nagar 55.84, Moti Nagar 51.85, Madipur 60.73, Rajouri Garden 60.74, Hari Nagar 57.35, Tilak Nagar 63.40, Janakpuri 59.12.12.12. , Vikaspuri 59.42, Uttam Naga 49.38, Dwarka 58.79, Matiala 47.36, Najafgarh 68, Bijwasan 58.17, Palam 63.50, Delhi Cant 39.52, Rajendra Nagar 55.44, New Delhi 51.64, Jangpura 56.14, Kasturba Nagar 49.19, Malviya Nagar 59.20, RK Puram 55.03, Mehrauli 46.59, Chhatarpur 62.68. Devli 61, Ambedkar Nagar 52.75, Sangam Vihar 59.88, Greater Kailash 61.56, Kalkaji 53.82, Tughlakabad 59.08, Badarpur 53.99, Okhla 50.05, Trilokpuri 55.78, Kondli 60.84, Patparganj 60.11, Laxmi Nagar 54.95, Vishwas Nagar 58.91, 59.681 Shahdara 59.26, Seemapuri 63, R Hotas Nagar 59.69, Seelampur 60.63, Ghonda 60.52, Babarpur 65.46, Gokalpuri 61.93, Mustafabad 66.29, Karaval Nagar have 63.24 percent polling.
Which party got how many seats
In the mid-term assembly elections in 2015, the Aam Aadmi Party won 67 seats and the BJP won 03 seats.
In the year 2013, BJP got 32 seats, AAP 28, Congress 08, others two seats.
In the year 2008, BJP 23, Congress 43, BSP 2, other two.
In the first election of 1993, BJP 49, Congress 14, Janata Dal got 04 seats.
When how much voting
Year 2015 – 67.12
Year 2013 – 65.63
Year 2008 – 57.58
Year 2003 – 53.42
Year 1998 – 48.99
Year 1993 – 61.75
(Voting figures in percent)